Urban Dynamic Studies
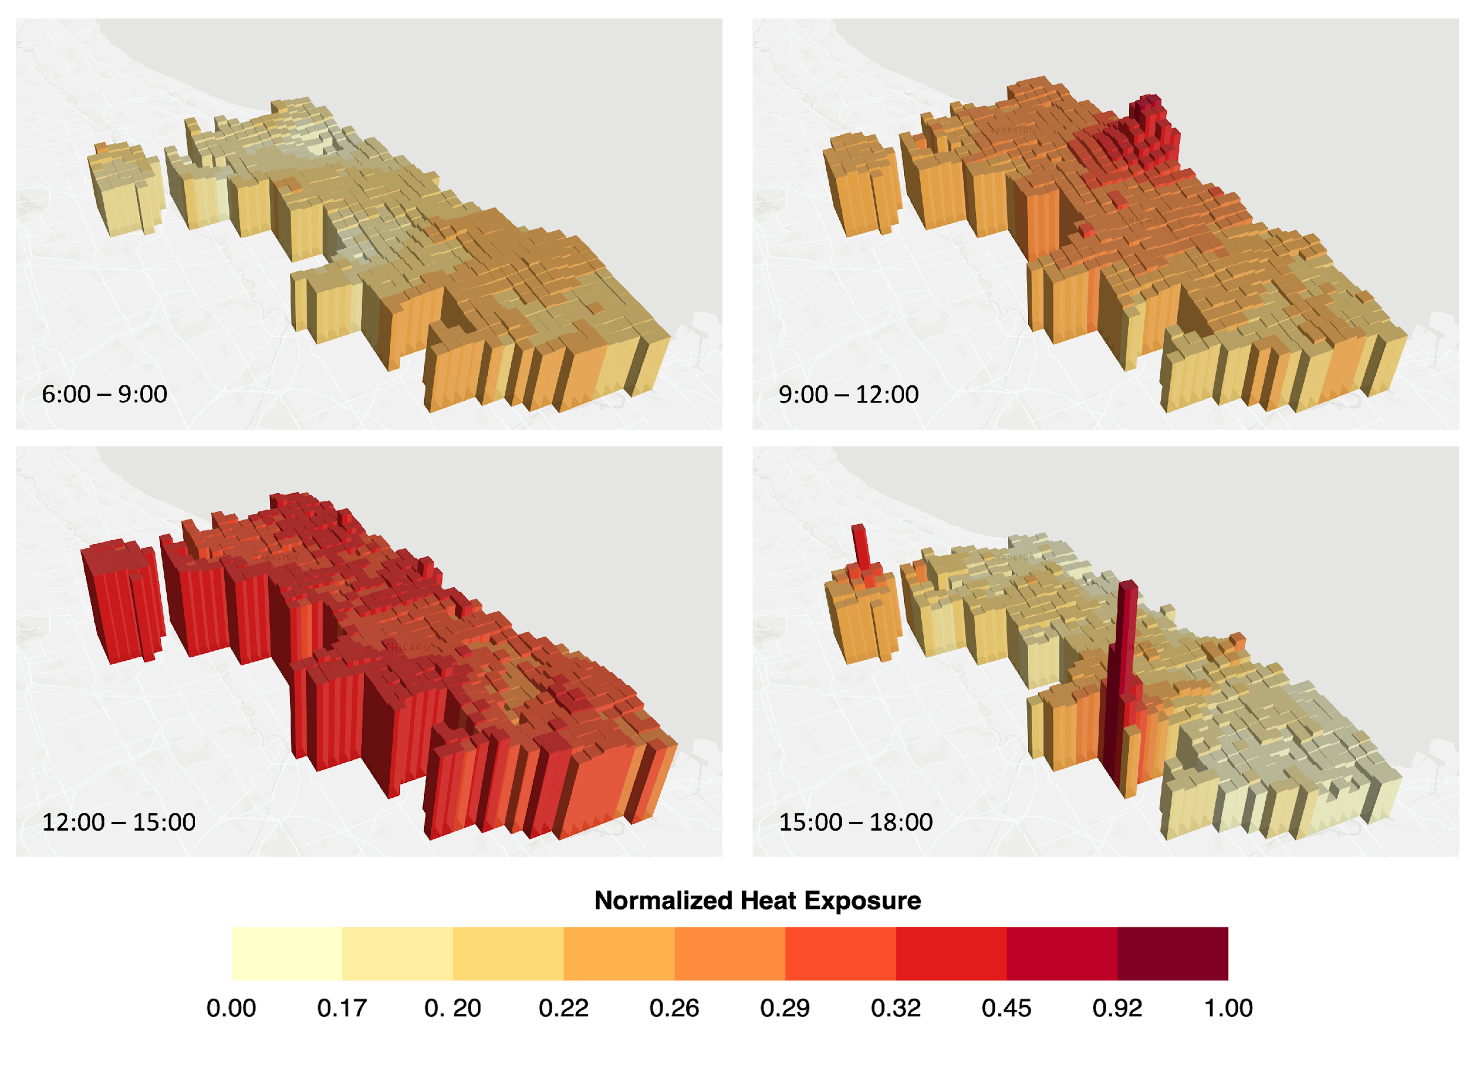
Human Sentiments of Urban Heat
Lyu, F., Zhou, L., Park, J., Baig, F., Wang, S. Mapping Dynamic Human Sentiments of Heat Exposure with Location‑Based Social Media Data. International Journal of Geographical Information Science, 1–24. https://doi.org/10.1080/13658816.2024.2343063
We built a model to map the dynamics of human sentiments of heat exposure with Location‑Based Social Media Twitter data. And we are modeling it in a near real-time fashion.
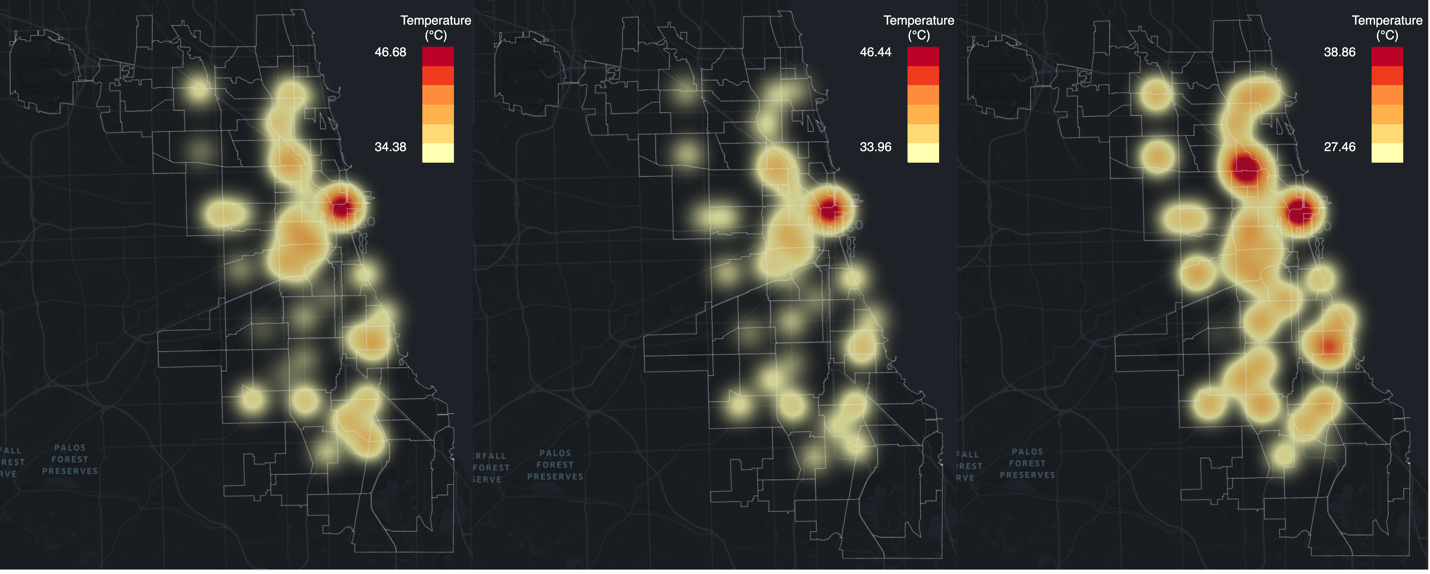
Urban Heat Dynamics
Lyu, F., Wang, S., Han, S.Y. et al. An integrated cyberGIS and machine learning framework for fine-scale prediction of Urban Heat Island using satellite remote sensing and urban sensor network data. Urban Info 1, 6 (2022). https://doi.org/10.1007/s44212-022-00002-4
Due to climate change and rapid urbanization, Urban Heat Island (UHI), featuring significantly higher temperature in metropolitan areas than surrounding areas, has caused negative impacts on urban communities. Temporal granularity is often limited in UHI studies based on satellite remote sensing data that typically has multi-day frequency coverage of a particular urban area. This low temporal frequency has restricted the development of models for predicting UHI. To resolve this limitation, this study has developed a cyber-based geographic information science and systems (cyberGIS) framework encompassing multiple machine learning models for predicting UHI with high-frequency urban sensor network data combined with remote sensing data focused on Chicago, Illinois, from 2018 to 2020. Enabled by rapid advances in urban sensor network technologies and high-performance computing, this framework is designed to predict UHI in Chicago with fine spatiotemporal granularity based on environmental data collected with the Array of Things (AoT) urban sensor network and Landsat-8 remote sensing imagery. Our computational experiments revealed that a random forest regression (RFR) model outperforms other models with the prediction accuracy of 0.45 degree Celsius in 2020 and 0.8 degree Celsius in 2018 and 2019 with mean absolute error as the evaluation metric. Humidity, distance to geographic center, and PM2.5 concentration are identified as important factors contributing to the model performance. Furthermore, we estimate UHI in Chicago with 10-min temporal frequency and 1-km spatial resolution on the hottest day in 2018. It is demonstrated that the RFR model can accurately predict UHI at fine spatiotemporal scales with high-frequency urban sensor network data integrated with satellite remote sensing data.
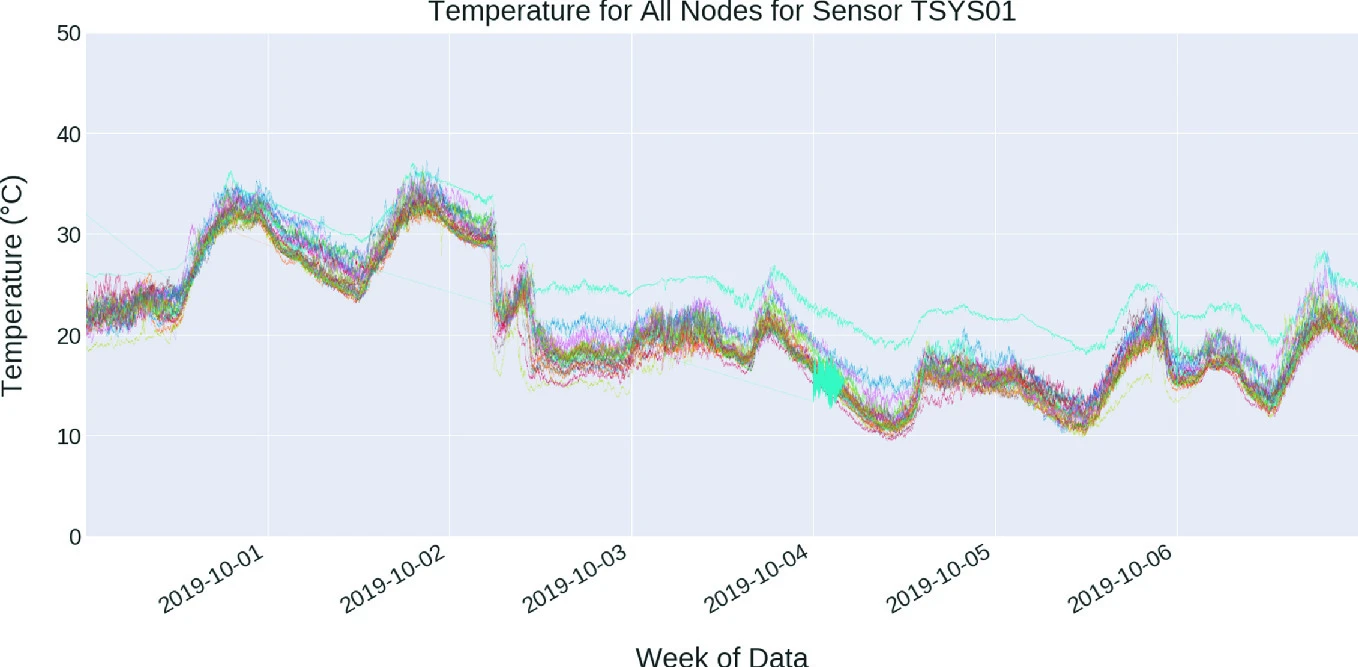
Urban Sensing Network for Streaming Analysis
Wang, S., Lyu, F., Wang, S., Catlett, C.E., Padmanabhan, A., Soltani, K. (2021). Integrating CyberGIS and Urban Sensing for Reproducible Streaming Analytics. In: Shi, W., Goodchild, M.F., Batty, M., Kwan, MP., Zhang, A. (eds) Urban Informatics. The Urban Book Series. Springer, Singapore. https://doi.org/10.1007/978-981-15-8983-6_36
Increasingly pervasive location-aware sensors interconnected with rapidly advancing wireless network services are motivating the development of near-real-time urban analytics. This development has revealed both tremendous challenges and opportunities for scientific innovation and discovery. However, state-of-the-art urban discovery and innovation are not well equipped to resolve the challenges of such analytics, which in turn limits new research questions from being asked and answered. Specifically, commonly used urban analytics capabilities are typically designed to handle, process, and analyze static datasets that can be treated as map layers and are consequently ill-equipped in (a) resolving the volume and velocity of urban big data; (b) meeting the computing requirements for processing, analyzing, and visualizing these datasets; and (c) providing concurrent online access to such analytics. To tackle these challenges, we have developed a novel cyberGIS framework that includes computationally reproducible approaches to streaming urban analytics. This framework is based on CyberGIS-Jupyter, through integration of cyberGIS and real-time urban sensing, for achieving capabilities that have previously been unavailable toward helping cities solve challenging urban informatics problems.
Urban Accessibility and Health
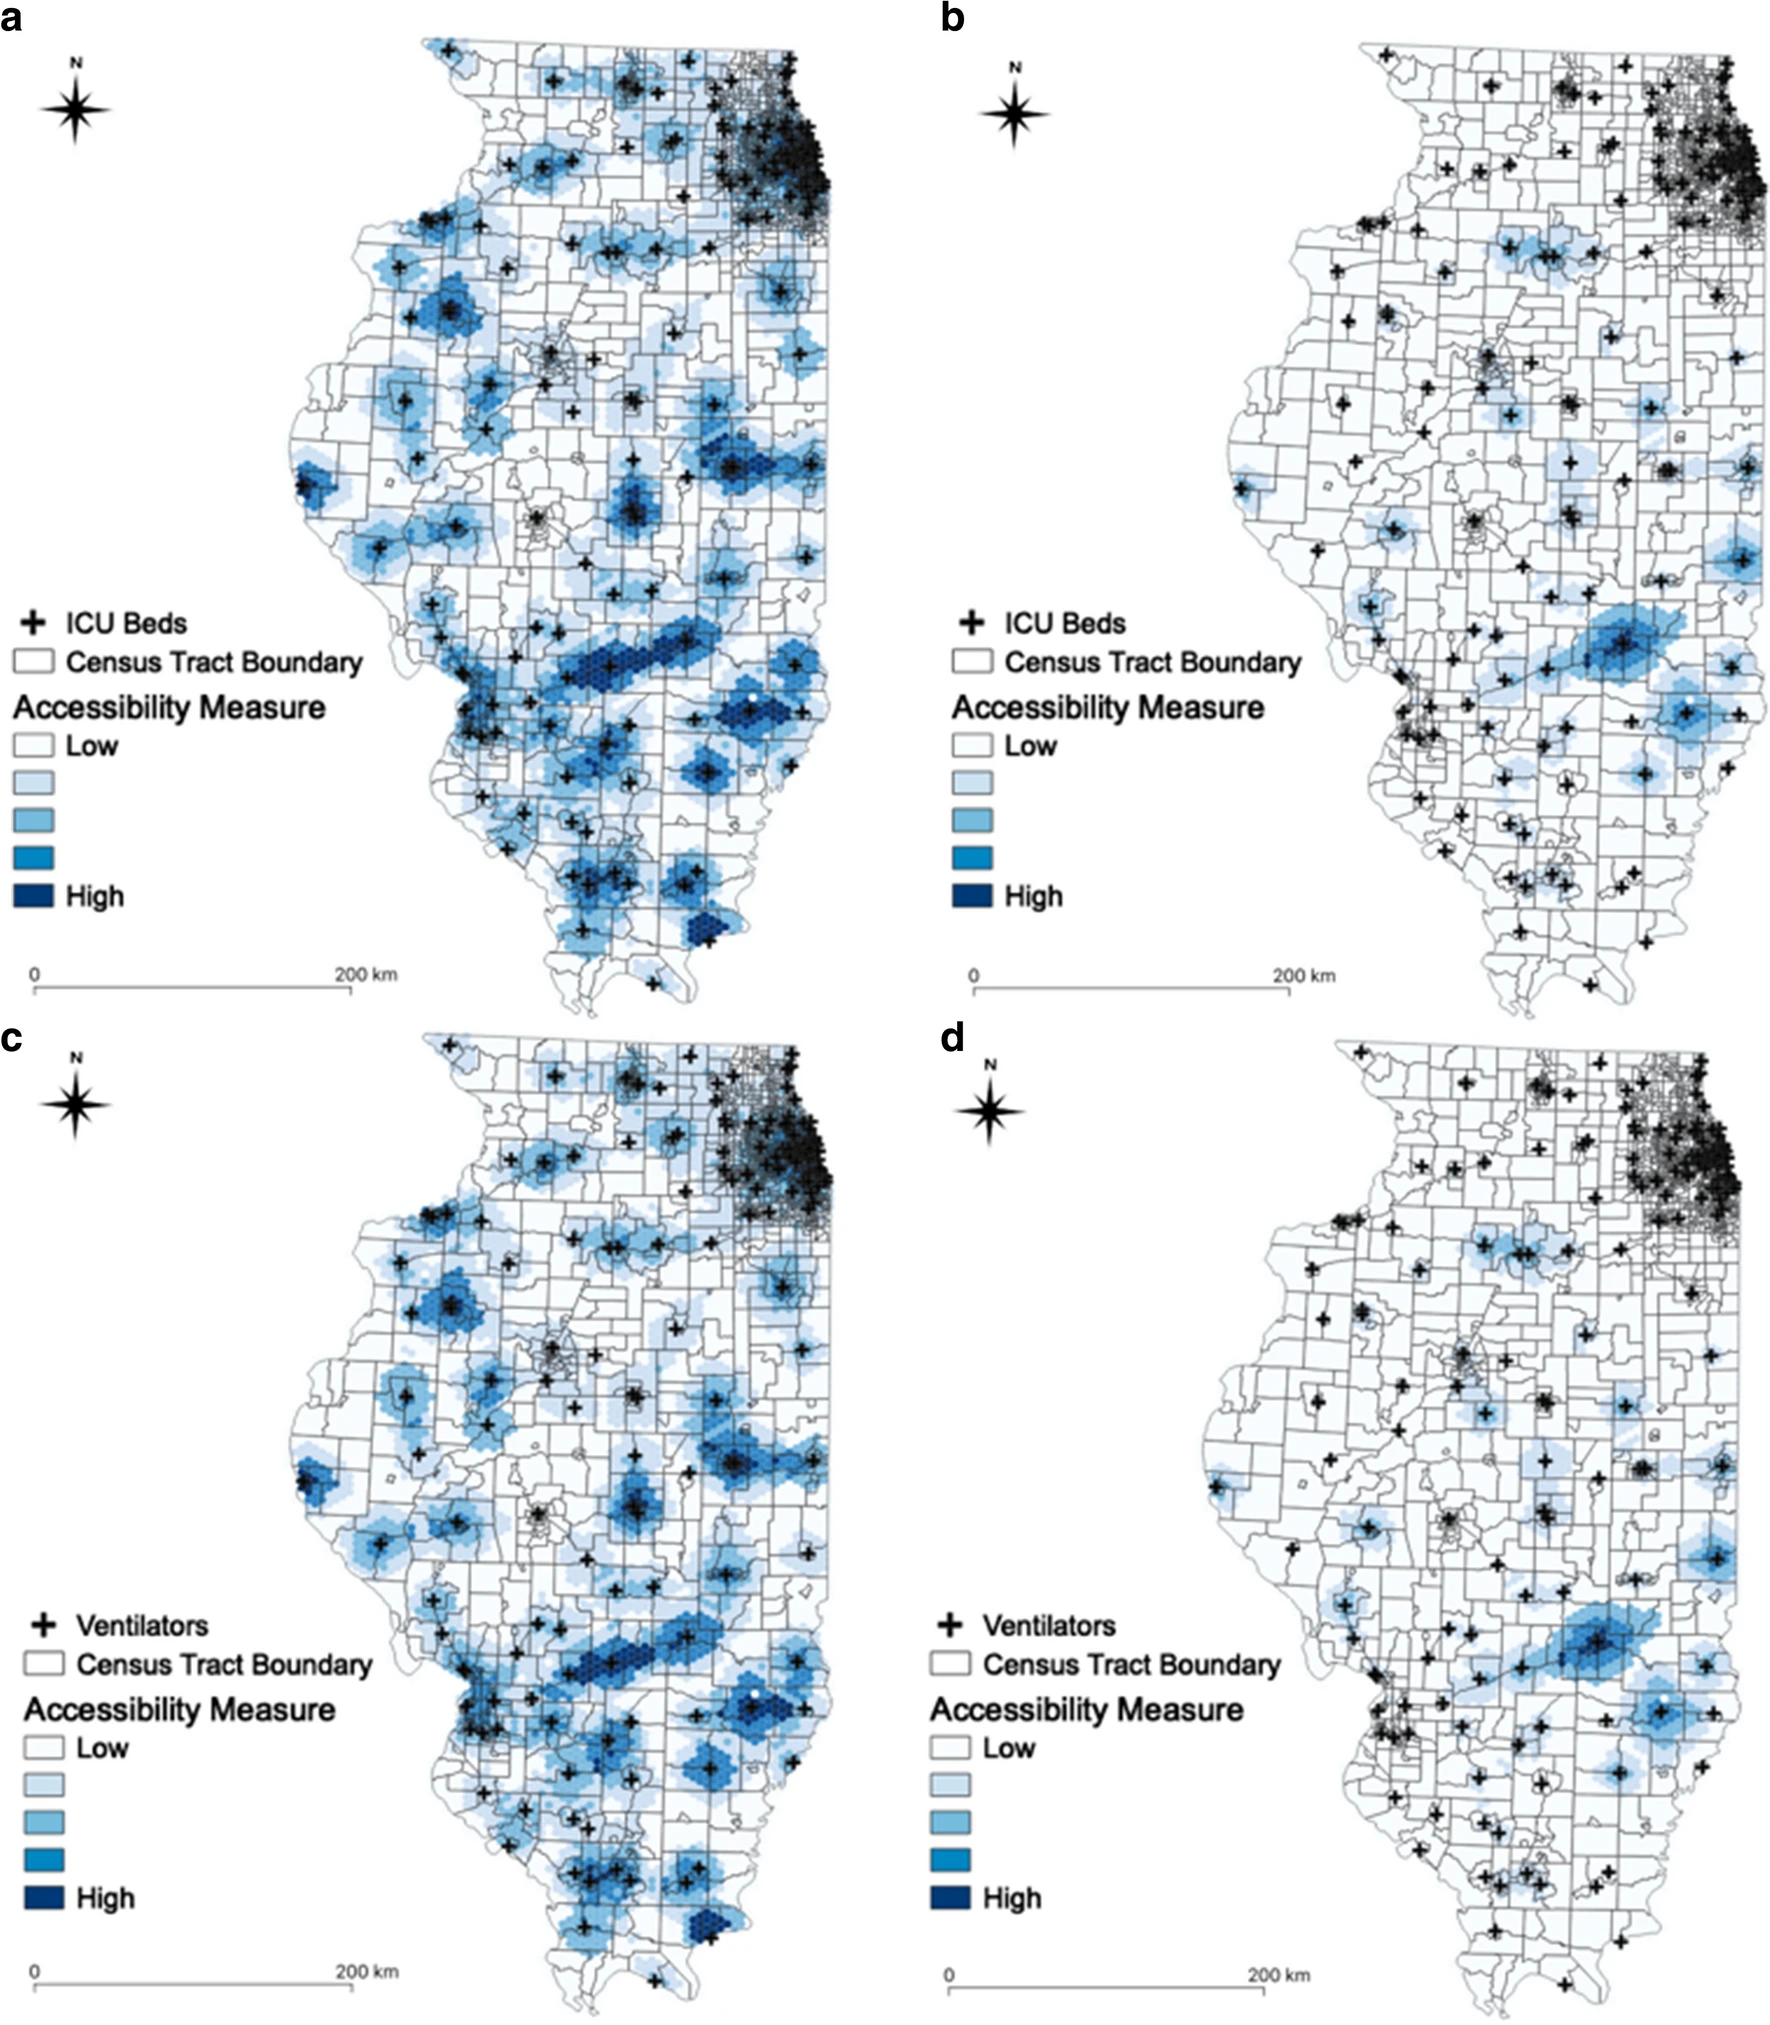
Kang, JY., Michels, A., Lyu, F. et al. Rapidly measuring spatial accessibility of COVID-19 healthcare resources: a case study of Illinois, USA. Int J Health Geogr 19, 36 (2020). https://doi.org/10.1186/s12942-020-00229-x
The severe acute respiratory syndrome coronavirus 2 (SARS-CoV-2), causing the coronavirus disease 2019 (COVID-19) pandemic, has infected millions of people and caused hundreds of thousands of deaths. While COVID-19 has overwhelmed healthcare resources (e.g., healthcare personnel, testing resources, hospital beds, and ventilators) in a number of countries, limited research has been conducted to understand spatial accessibility of such resources. This study fills this gap by rapidly measuring the spatial accessibility of COVID-19 healthcare resources with a particular focus on Illinois, USA.
Taxi Trajectory Clustering in Urban Area
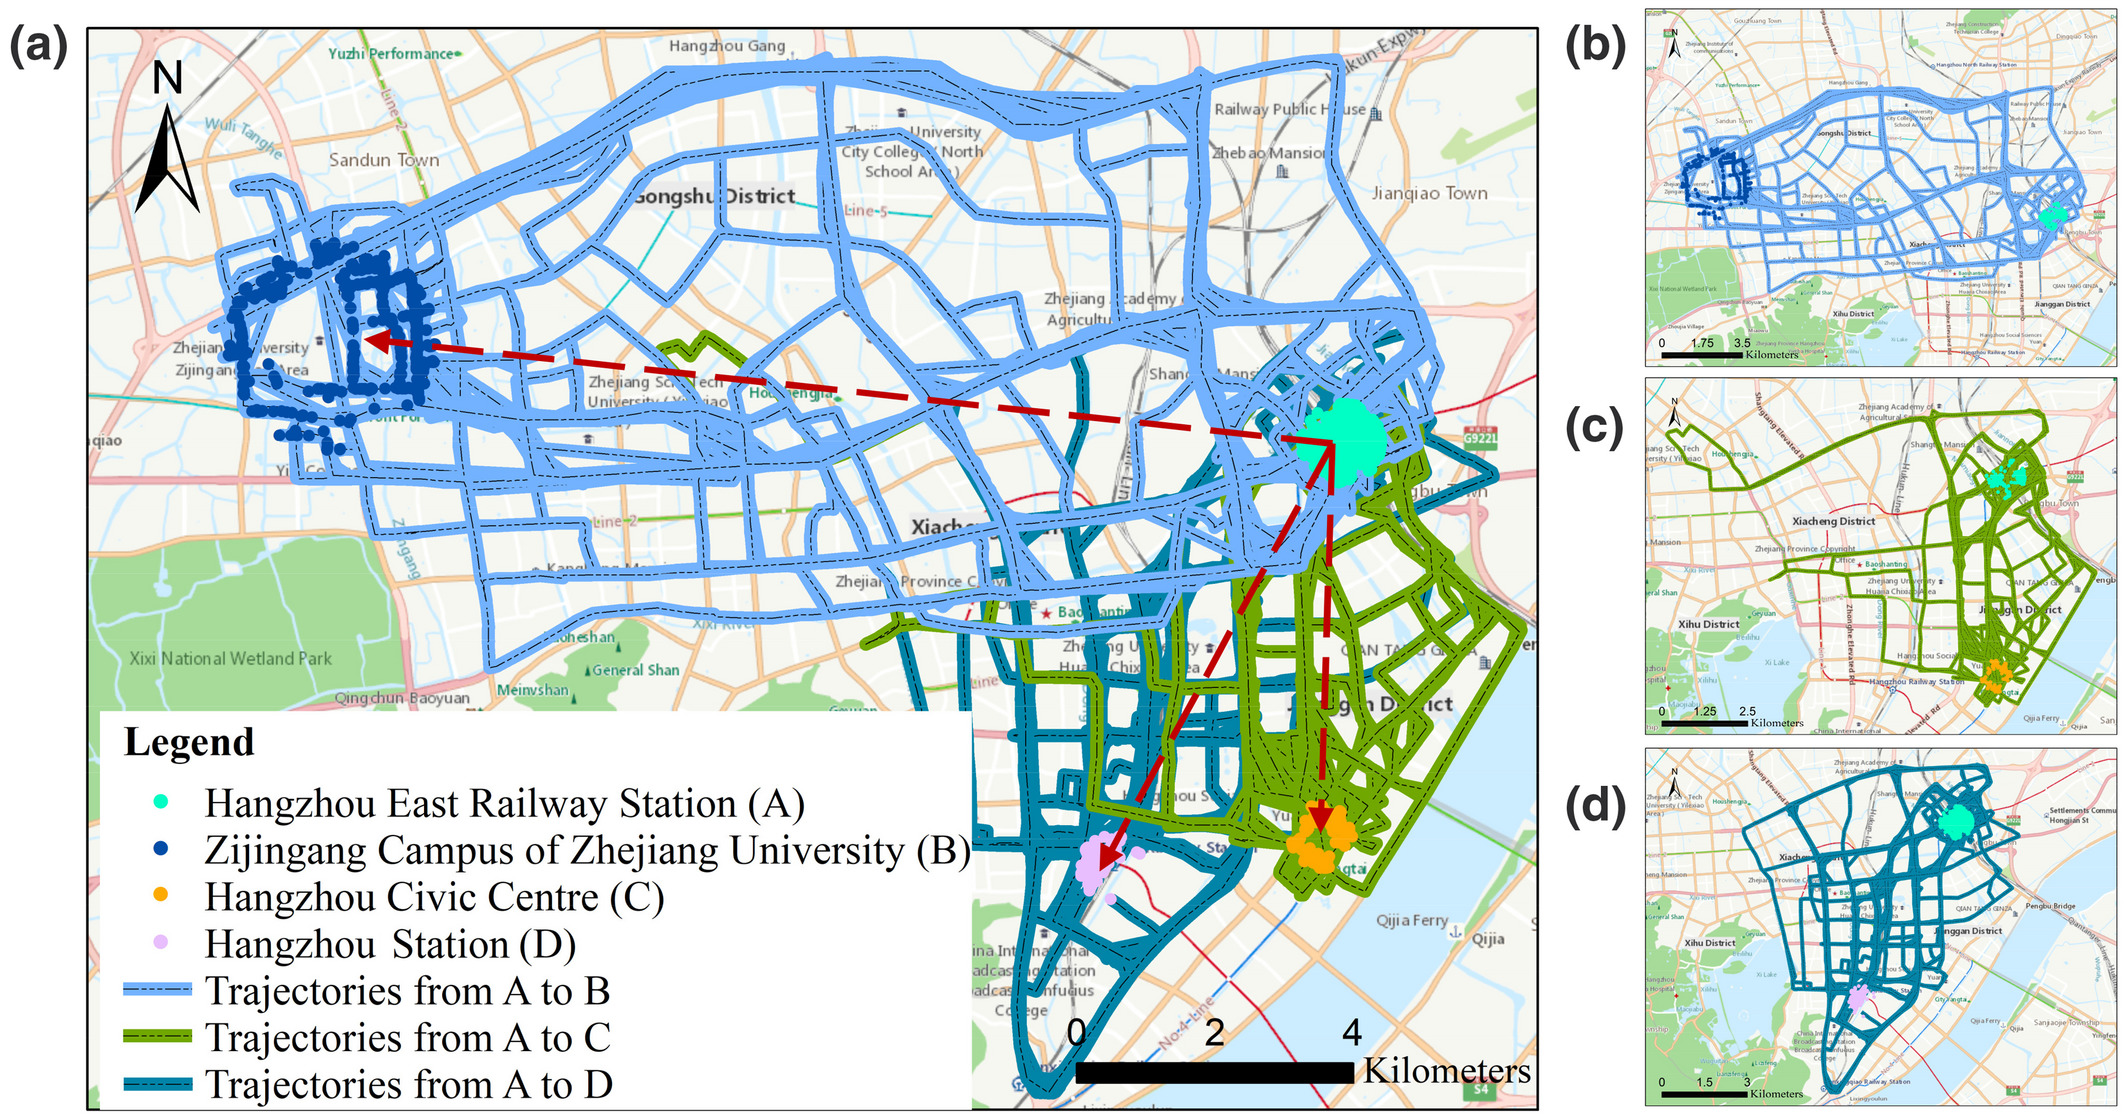
Wang, C., Lyu, F., Wu, S., Wang, Y., Xu, L., Zhang, F., Wang, S., Wang, Y., Du, Z. (2022). A deep trajectory clustering method based on sequence‑to‑sequence autoencoder model. Transaction in GIS, 26, 1801– 1820. DOI: 10.1111/tgis.12905
Most existing trajectory clustering methods use point matching similarity measurement strategies to compare trajectory objects; however, such methods have poor similarity measurement accuracy, which reduces clustering quality. To address this research gap, this article considers a combination of trajectory-feature learning and clustering. A deep trajectory clustering (DTC) method toward clustering-friendly spaces is proposed to simultaneously learn trajectory representations (i.e., low-dimensional vectors are used to represent trajectories) and cluster centroids, and further acquire the cluster assignments end to end. We first use a sequence-to-sequence autoencoder network for pretraining to obtain preliminary trajectory vectors, and then jointly optimize the learned representations and cluster centroids under the same framework. The effectiveness of DTC is demonstrated in synthetic datasets, and the learned representations in the real world can be used to identify hot routes in cities.
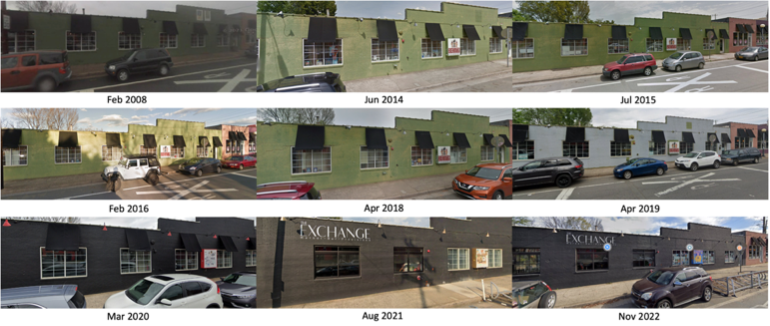
Street View Image for Urban Change Detection
Lyu, F., Ma, X., Song, Y., Zhu, E., Wang, S. (2023). Large‐scale Google Street View Images for Urban Change Detection. I‐GUIDE Forum 2023. DOI: 10.5703/1288284317674
Urbanization has entered a new phase characterized by urban changes occurring at a micro-scale and “under the roof”, as opposed to external modifications. These changes, known as urban retrofitting, involve the incorporation of novel technologies or features into pre-existing systems to promote sustainability. Given the limitations of remote sensing images in identifying such urban changes, novel tools need to be developed for detecting urban retrofitting. In this study, we first build a pipeline to collect large-scale time-series urban street view images from Google Street View in Mecklenburg County, North Carolina. And we examine the feasibility of utilizing the acquired dataset to detect diverse forms of urban retrofitting, including re-building, re-greening and re-capital.